News


The latest news and updates from Renewables.ninja. Posts are also available through an RSS feed.

Ninja v1.3 - New data released to end of 2019

07 Apr 2020

Today we release v1.3 of the Renewables.ninja dataset. All the wind, PV and weather simulations now run until the end of 2019.

The custom point simulations and API now offer data from 2000 until 2019, giving you access to the most recent weather year.

The aggregated data packages available on the country interface now run from 1980 to 2019, giving forty years of data to work with. Aggregated time-series are …
Read more

New API format and model upgrades go live

25 Jul 2019

Earlier last month we announced that the API format is going to change to make the ninja platform more consistent and easier to deal with. These changes have gone live today.

If you use the maps on our the web interface then you won’t be affected by this, and can carry on working as you have done before. If you access Renewables.ninja through other programs and scripting languages, then you …

Read more

Late spring housekeeping and upcoming API changes

03 Jun 2019

Additional wind power curves

We have updated the power curves that are available for simulating wind farms. Twenty new power curves are available, mainly covering the newest and largest turbines available. These include the 8 and 9 MW turbines from Vestas with 164m blades, 5 MW turbines from GE and the 140m bladed Goldwind GW140. Big thanks to Malte Jansen for helping to compile manufacturer data.

A full list of …

Read more

Happy birthday Ninja

08 Apr 2019

Three years ago we launched Renewables.ninja and got our first user! It’s great to see the service grow over that time, and today we hit 4 million simulations run! Thank you to all our users for helping to further the renewable energy transition.

We haven't had any updates for a while – as we've been working on some big things behind the scenes. More on that soon, but today …

Read more

New sub-national data for Europe

27 Jul 2018

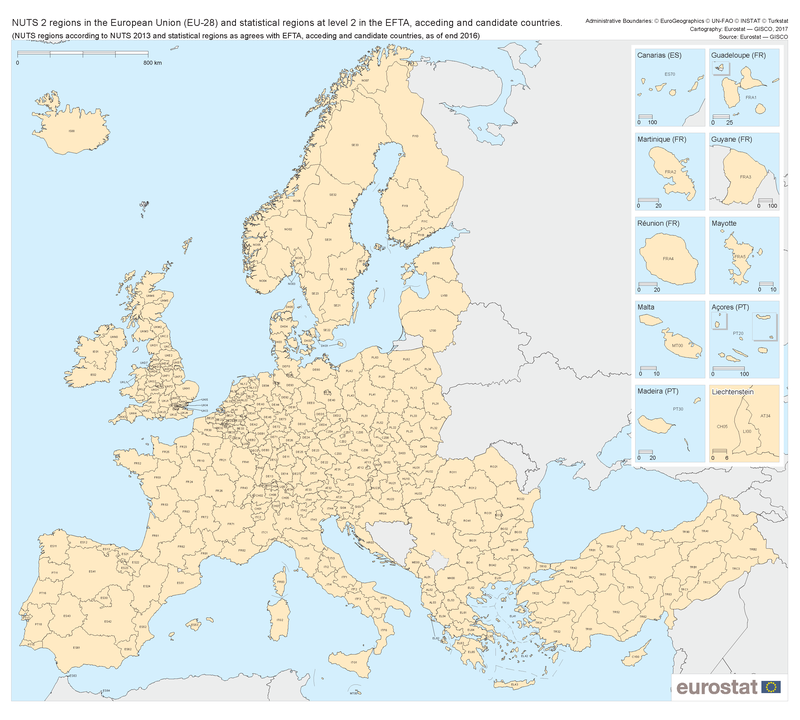
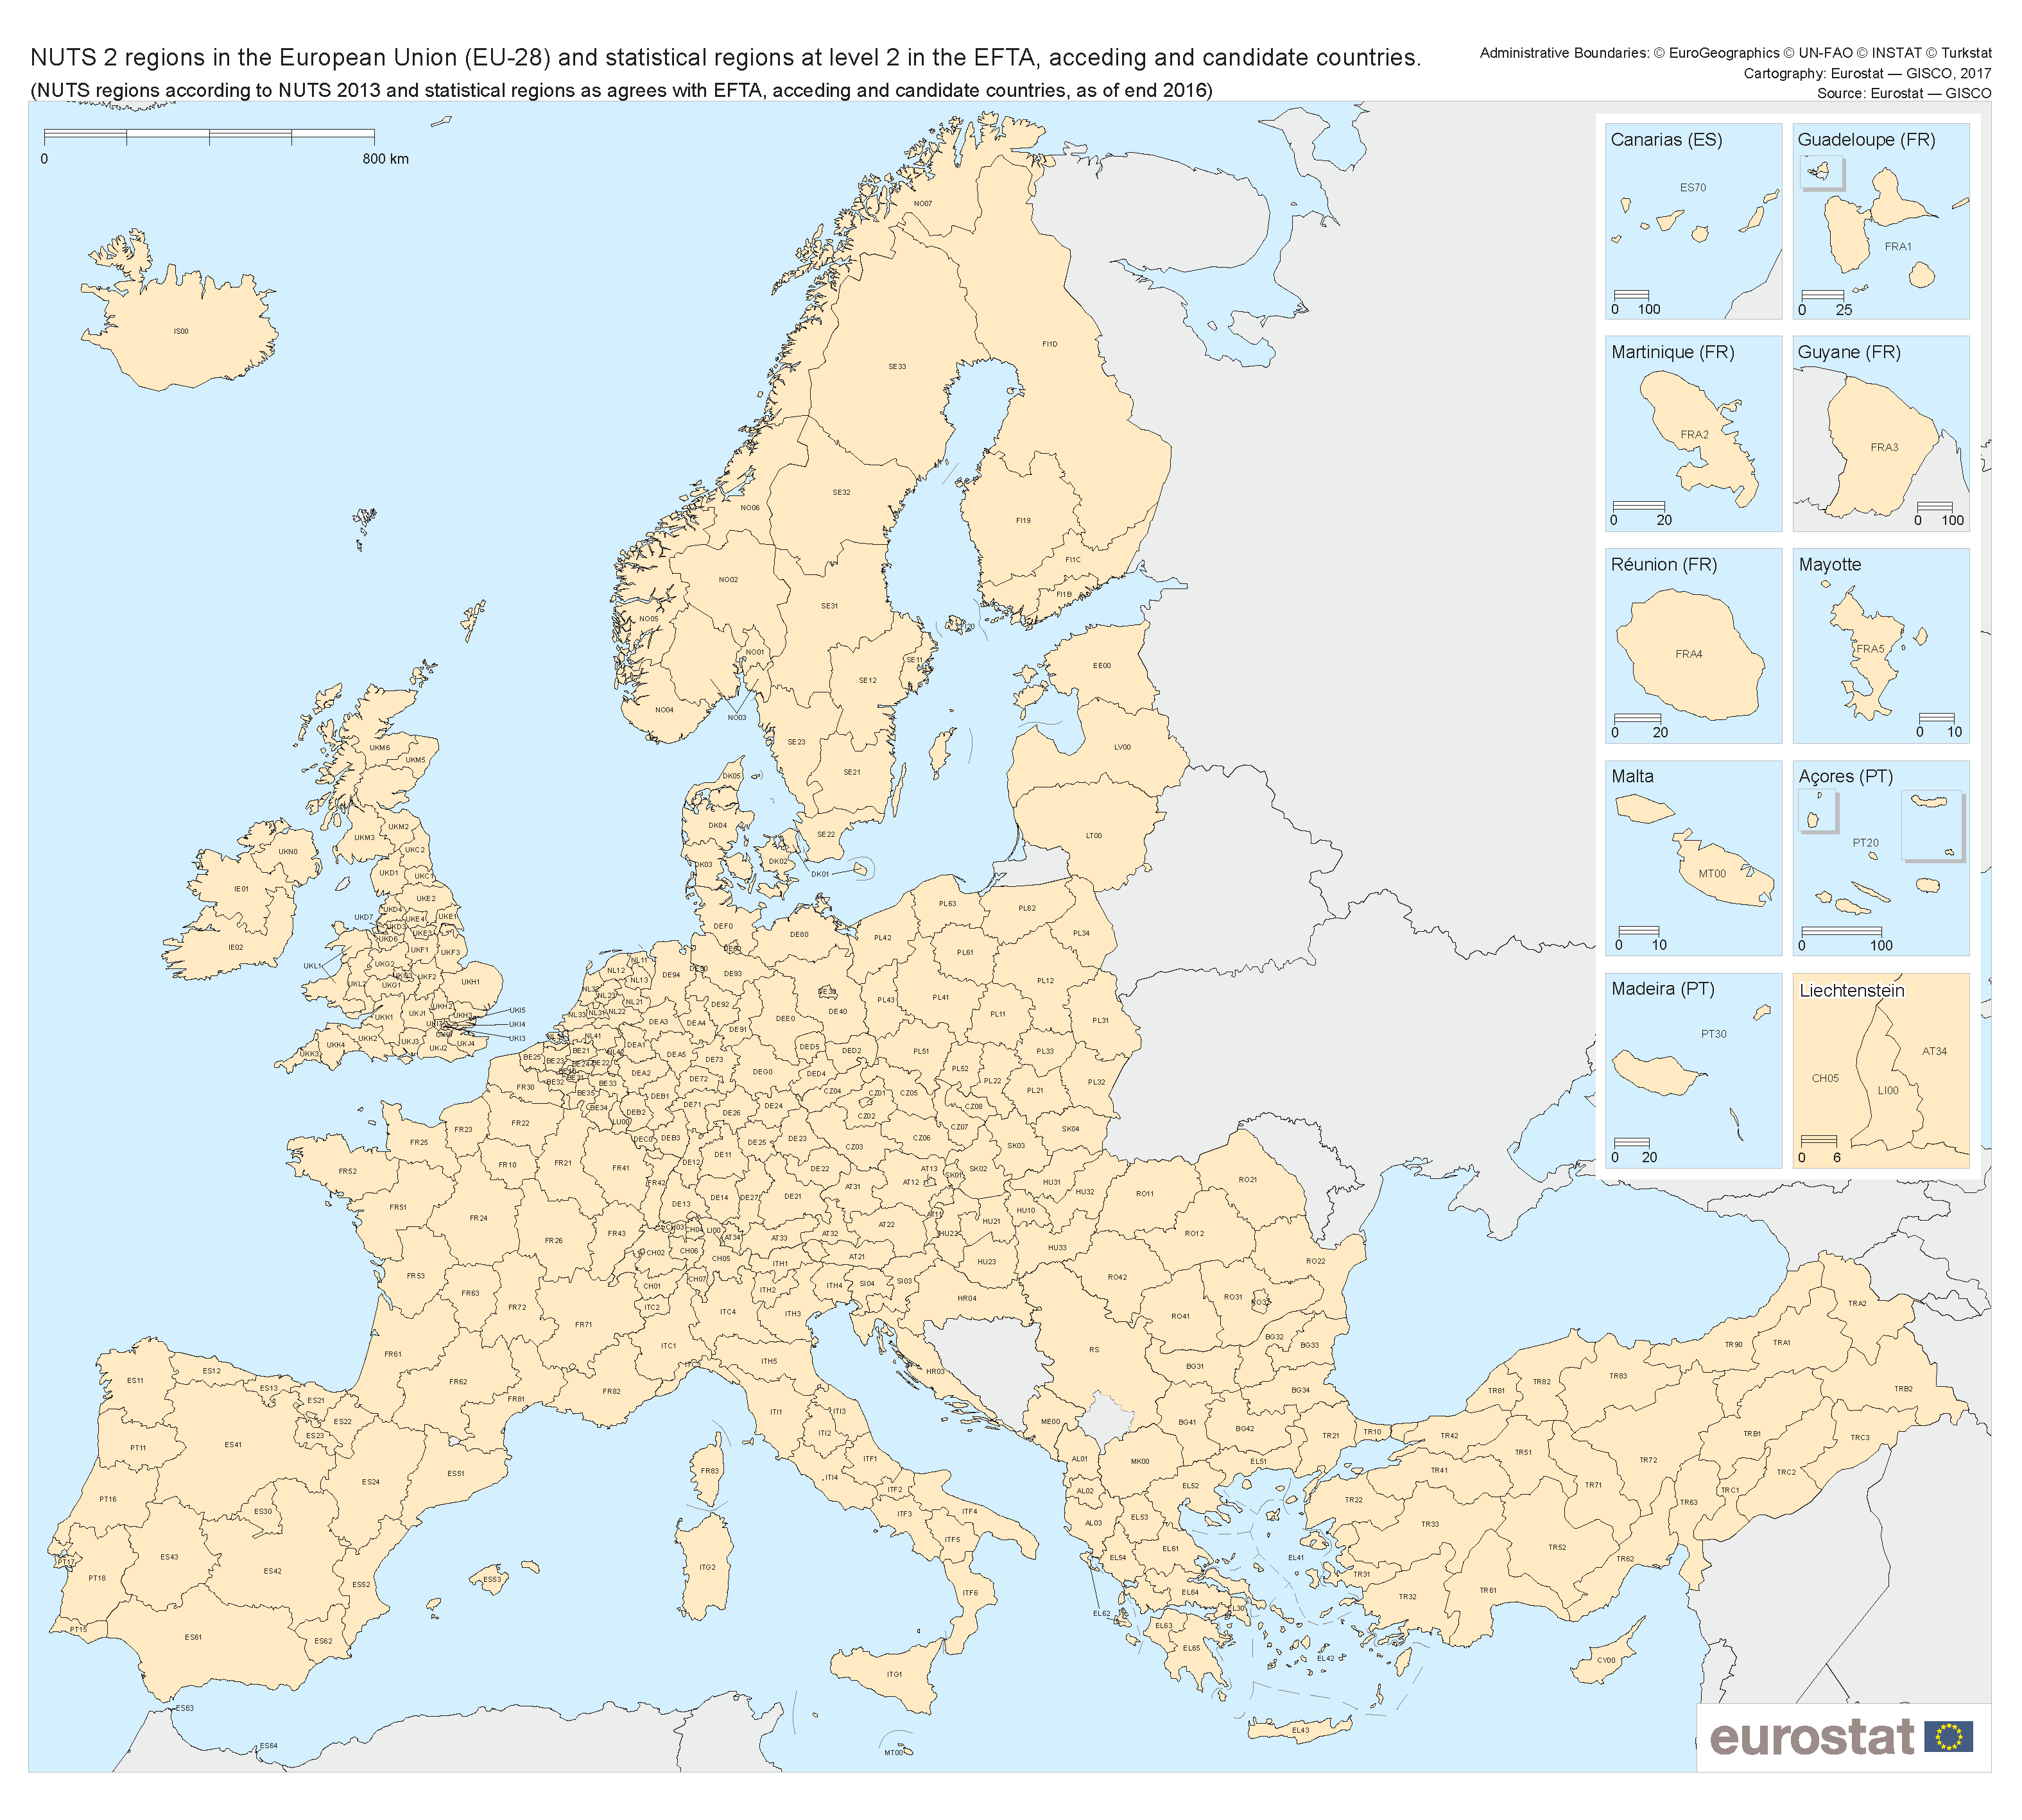
We are pleased to announce a new dataset for download. We have simulated Europe’s fleet of wind and PV plants and aggregated it to NUTS-2 regions. This gives more granular detail than our existing national dataset, splitting 29 countries in Europe into 281 regions as pictured here:

NUTS_2_regions_in_the_European_Union_(EU-27)_and_statistical_regions_at_level_2_in_the_EFTA_and_candidate_countries.png

(Image source and full-resolution version: Eurostat)

We have also produced maps of the NUTS zones in each individual country …

Read more